Curious what actions users are taking – or rather, not taking – on your website? Questioning what content they’re stopping to read and what they’re scrolling right on past?
All these uncertainties and more can be answered with heat maps – a useful and easily understood data visualization tool we use every day.
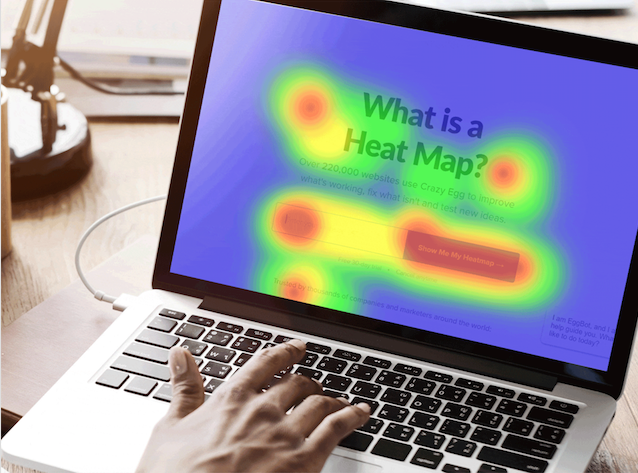
At WDC, we consider heat maps our best friend when it comes to understanding user behavior across your website. Using a warm-to-cool color spectrum, the visual storytelling tool highlights which areas of your website garner the most attention, and which ones don’t quite make the cut.
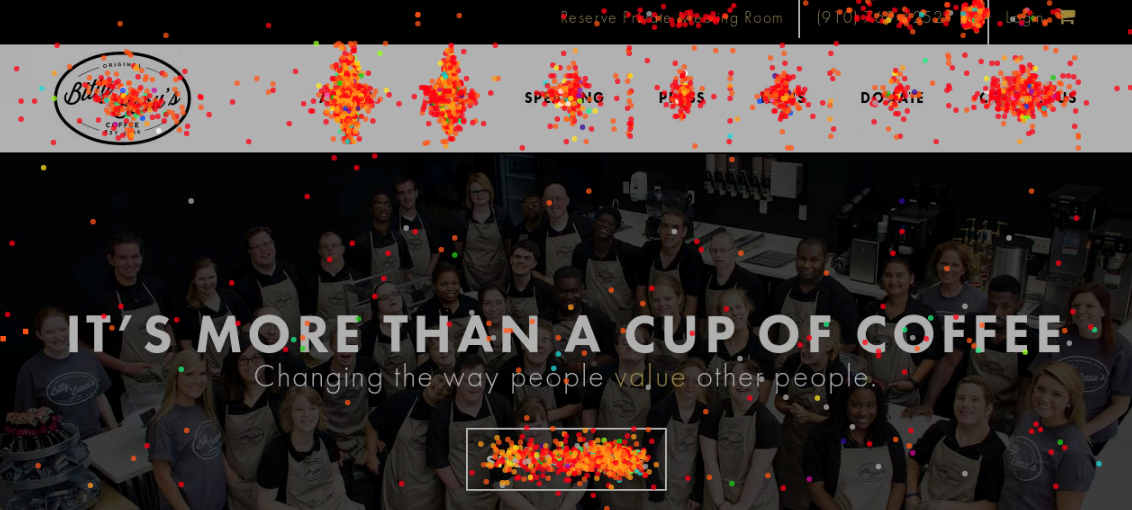
Various types of heat maps show us where users are clicking, how far they scroll on a page, and more, in a way that's simple to interpret and translate into future design, development and marketing decisions.

Vantaca’s Balancing Act
Audrey Elsberry
-
May 17, 2024
|
|
Channel, UNC Law School Aid Wilmington Small Businesses
Audrey Elsberry
-
May 16, 2024
|
|
Developers Mark Opening Of $78M Apartment Project At Riverlights
Staff Reports
-
May 17, 2024
|
|
Two Apartment Projects Pitched For Kerr Avenue
Emma Dill
-
May 17, 2024
|
|
As Hurricane Season Heats Up, How Do Builders, Laws Prep Homes For Storms?
Emma Dill
-
May 17, 2024
|
Ocean City Beach was established in 1949 and became the first community in the state where Black people could purchase oceanfront property....

The YMCA of Southeastern North Carolina has about 13,000 members; approximately 11,000 live in the greater New Hanover County area....

Outdoor dining spaces add another dimension to dining in the Port City and, in some cases, take a restaurant’s brand to new heights. ...

The 2024 WilmingtonBiz: Book on Business is an annual publication showcasing the Wilmington region as a center of business.