This Insights article was contributed by Edward Graham, Professor of Finance at UNCW's Cameron School Business.
The U.S. residential real estate market has been a leading topic in the news over the last decade or more.
With increasing mortgage delinquencies in late 2007 and the bursting of the real estate bubble soon thereafter, home values across the U.S. began an historic decline.
The Case-Shiller Home Price Index (Table I below) captures both the escalation in home values between 2000 and 2006, the correction in house prices as the housing bubble burst, and the recovery, on average, of the housing market across the U.S. by mid-2018. Prices, on average across the U.S. more than doubled in the years ending in the spring of 2007.
In the Cape Fear Region, using an admittedly informal but representative “index” created using home sales data provided by the Wilmington Regional Association of Realtors (WRAR), prices increased over 75 percent in the years ending in the spring of 2007.
Prices then fell across the local market but have since recovered. Few expected the recovery of the real estate market, in either Southeastern North Carolina or across the nation, to be as rapid as it has been.
Reflected in the data in Table I, declinations in house prices were observed across the U.S. and Cape Fear region between 2007 and 2012. Since then, prices in most neighborhoods across the Wilmington area have reached or surpassed prior peaks in 2007.
Discussed below, this pattern has proven a quandary for the new student in real estate investments, as he or she examines local “opportunities.” Real estate is once again “expensive,” and finding “deals” with assured favorable returns is becoming more complicated.
| Month Year |
Cape Fear Regional Index*, ** | 20-City Index*** |
| January 2000 | 100.00 | 100.59 |
| March 2001 | 110.88 | 115.09 |
| March 2002 | 109.08 | 123.31 |
| March 2003 | 112.11 | 138.36 |
| March 2004 | 123.12 | 156.88 |
| March 2005 | 135.52 | 183.12 |
| March 2006 | 152.48 | 206.03 |
| March 2007 | 177.21 | 203.78 |
| March 2008 | 165.09 | 174.90 |
| March 2009 | 143.74 | 143.15 |
| March 2010 | 138.77 | 146.85 |
| March 2011 | 147.84 | 141.23 |
| March 2012 | 138.52 | 137.37 |
| February 2013 | 143.74 | 149.80 |
| May 2013 | 156.02 | 156.06 |
| April 2014 | 163.49 | 168.73 |
| March 2015 | 160.99 | 174.98 |
| March 2016 | 164.27 | 184.52 |
| March 2017 | 179.06 | 195.35 |
| June 2017 | 188.91 | 200.43 |
| September 2017 | 187.27 | 203.63 |
| December 2017* | * | 204.44 |
| March 2018* | * | 208.50 |

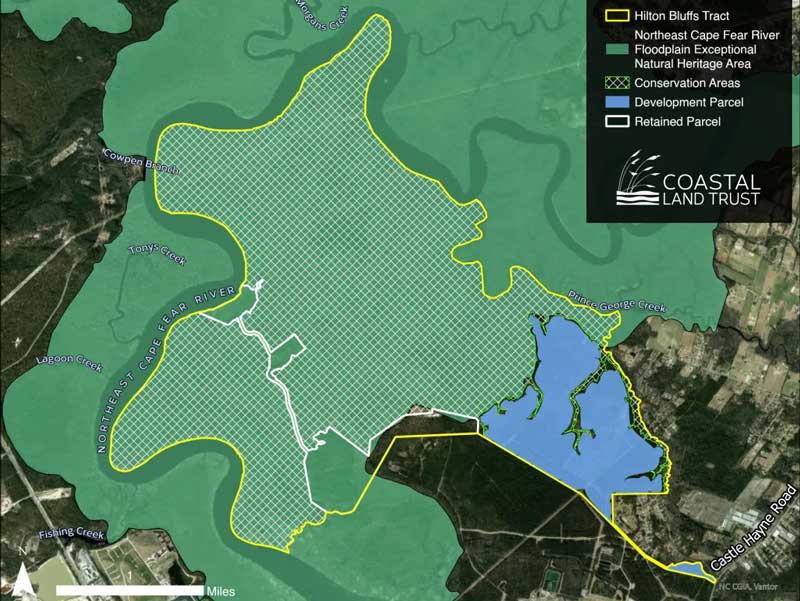
Coastal Land Trust Strikes Deal To Preserve More Than 3,200 Acres Of Sledge Forest
Cierra Noffke
-
Jun 25, 2026
|
|
Refinery Project Eyeing Brunswick County Could Bring $500M Investment, 300 Jobs
Emma Dill
-
Jun 26, 2026
|
|
Tech Wilmington: Upcoming Events Calendar
Staff Reports
-
Jun 24, 2026
|
|
As Local Firms Exit State Incentive Deals, 2 Remain Active
Emma Dill
-
Jun 25, 2026
|
|
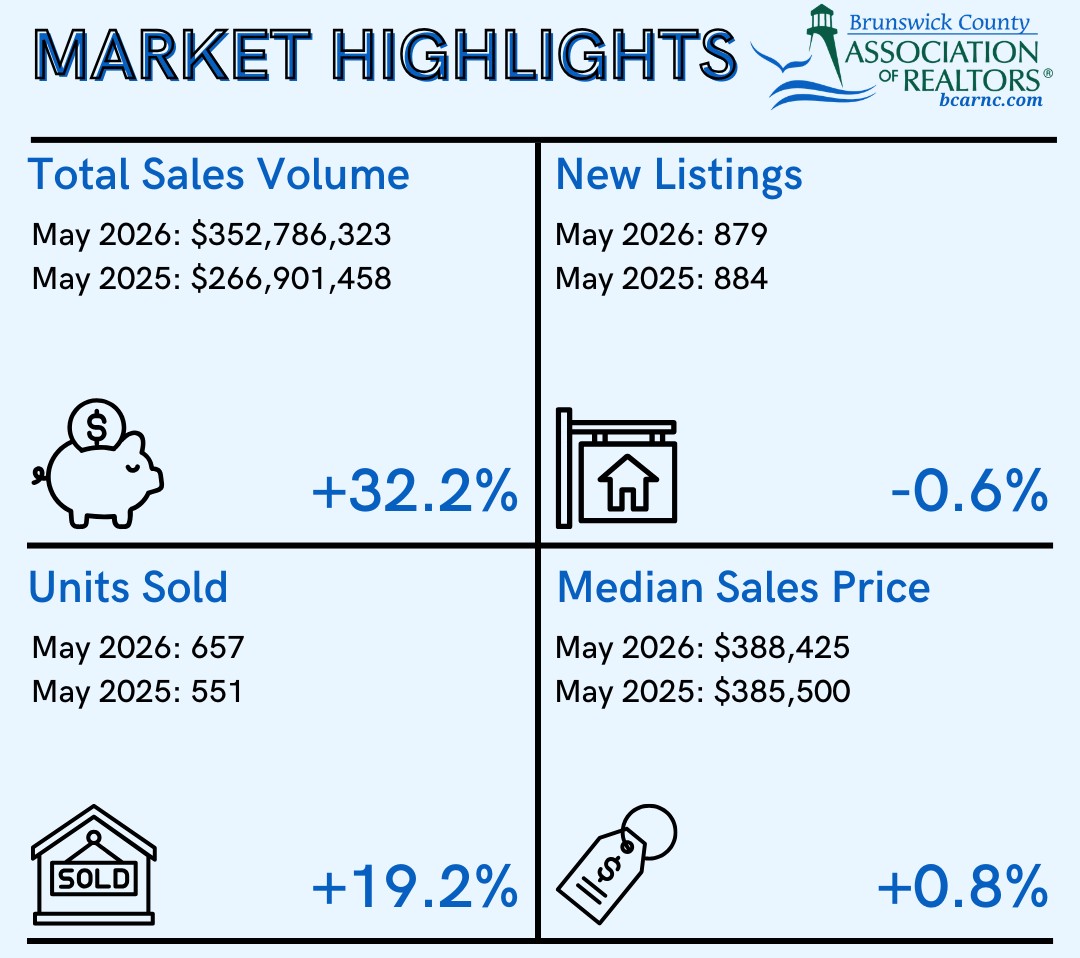
Brunswick Realtors: Home Sales Hit New High In May
Staff Reports
-
Jun 26, 2026
|
|

Need a Fence Company is a residential fencing company that provides Wilmington and the surrounding areas with fence materials, installation...

The founder of the Network for Entrepreneurs in Wilmington (NEW) and Wilmington Angels for Local Entrepreneurs (WALE), Jim Roberts is vocal...
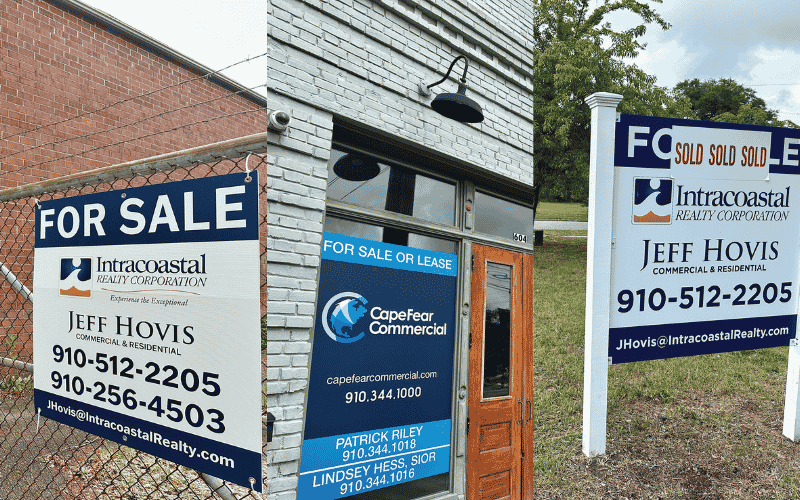
In the past six months alone, a broker with Intracoastal Realty Corp. said he’s sold four lots in the Brooklyn Arts District corridor....

The 2026 WilmingtonBiz: Book on Business is an annual publication showcasing the Wilmington region as a center of business.