Curious what actions users are taking – or rather, not taking – on your website? Questioning what content they’re stopping to read and what they’re scrolling right on past?
All these uncertainties and more can be answered with heat maps – a useful and easily understood data visualization tool we use every day.
At WDC, we consider heat maps our best friend when it comes to understanding user behavior across your website. Using a warm-to-cool color spectrum, the visual storytelling tool highlights which areas of your website garner the most attention, and which ones don’t quite make the cut.
Various types of heat maps show us where users are clicking, how far they scroll on a page, and more, in a way that's simple to interpret and translate into future design, development and marketing decisions.
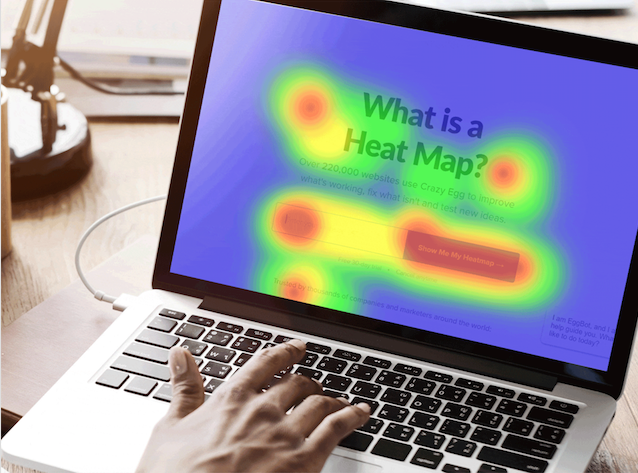
Traditional Heat Map
Analyzing a traditional heat map is where we start when looking to make improvements to your site, as it provides an overview of where visitors are clicking on a page. As a certain area receives more clicks, the color on the heat map will intensify, signaling a website hot spot.
The ability to clearly see where user attention is focused allows us to test our own assumptions and make site changes that align with your business goals. Let’s say we notice hot spots within your site’s header image. We may consider conducting an A/B test, swapping different content and graphics in that area to see what interests the consumer has and which variation has a higher click-through or engagement rate.
Scroll Map
Using a scroll map, we’re able to prioritize the content on your page by showing what sections have the highest concentration of views before users bounce.
Knowing what areas of your page gets the most eyeballs helps us to discover your so-called CTA (call-to-action) sweet spots and better draw focus down the page to dismantle those pesky dead zones. Because users have such a shortened attention span, getting your most valuable content in front of people early is a key.
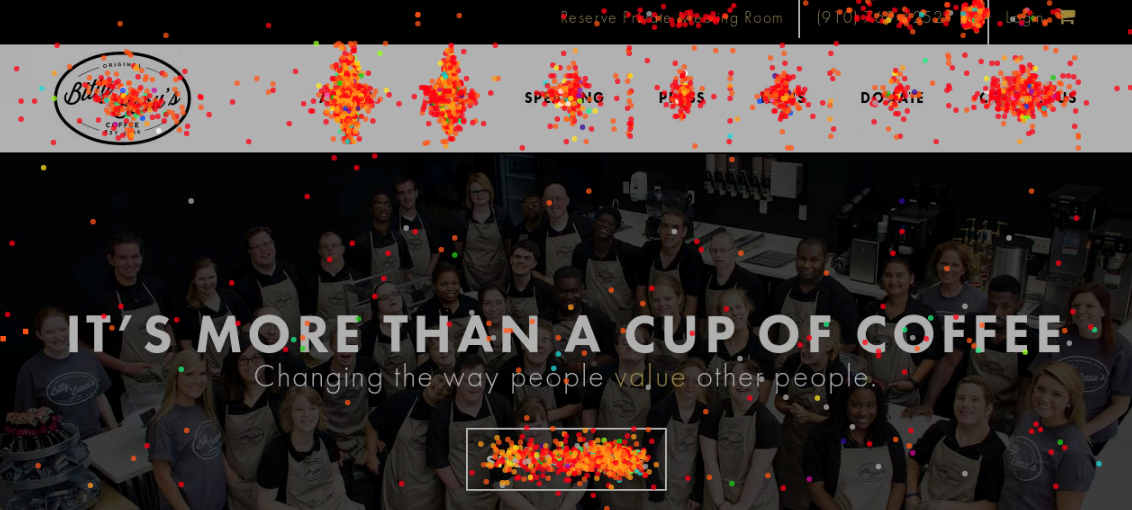
Confetti Map
With a confetti map, we see individual clicks, represented by colorful dots that change based on chosen metrics such as new versus returning users, device type, or where they were referred from.
Confetti reports help uncover blockers and provide insight into previous unknowns. For instance, your page may have a high bounce rate, meaning users typically leave after viewing one page. Your report could indicate that users are clicking items that don’t have click-through functionality, causing them to become flustered and leave the site. Making appropriate UX/UI design changes will help your users navigate fluidly across your entire site.
With the help of heat maps, we as digital marketers are able to form a deeper understanding of user behavior and make changes to your website backed by sizeable data.
Furthermore, heat maps allow us to:
- Easily conduct A/B tests and track changes to see what variations produce better results
- Draw attention to the most user-engaging areas of your website
- Zero in on the most effective messaging and content
- Arrange your navigation bar to reflect pages you want to send the most traffic to
Want to make more data-informed decisions when it comes to your website’s structure and design to help reach your customers? We are the heat map gurus. Let’s talk!
Like this article? Check out more just like it at
wilmingtondesignco.com
At WDC, we believe honest business and innovative design go hand-in-hand. Our talented team of designers, marketers, and developers are as diverse as their work. We offer a range of services from creative web design and development to digital marketing strategies and branding solutions tailored specifically to your business. Contact Bill at [email protected] or visit www.wilmingtondesignco.com.